"Can all tasks or issues be completed by the due date?" The burndown charts in Backlog answers your question. It showcases your current milestones, and reflects your milestone progress. By plotting a line graph of hours of work remaining on the vertical axis and the milestone’s timeline on the horizontal axis, it shows the remaining amount of work to be done over time.
As time passes, the outstanding tasks decrease, and the line in the graph will decrease or “burn down” from left to right.
When you track your work via a burndown chart, you can easily track your progress! The burndown chart provides an indication of whether you’re going to reach your goal, and if you’re not, you can take steps to get your team back on track!
|
Note: Burndown chart function is only available to users under the Standard plan and above. |
There are 3 lines plotted on the burndown chart.
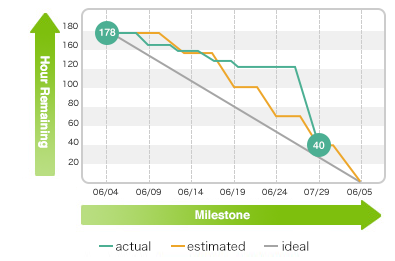
Actual Line![]()
The Actual Line indicates the actual results of work progress by showing the current amount of outstanding issues/tasks (i.e. total “Estimated Hours”), and it decreases as issues are completed.
Estimated Line 
The Estimated Line shows the estimated progress of work. It is calculated based on the issue’s "Due Date" and "Estimated Hours". The Actual Line overlaps the Estimated Line when tasks are completed as planned.
Ideal Line
The Ideal Line is drawn by averaging the amount of tasks’ hours over the number of days. This line can be used to verify whether the plan is appropriate.
Understanding your burndown chart
When the project milestone is progressing as estimated

When the project milestone is progressing as estimated, the “Actual Line” will be displayed below the “Estimated Line”.
When the project milestone is not progressing as estimated

When the project milestone is not progressing as estimated, the “Actual Line” will be displayed above the “Estimated Line”.
|
Tip: When the progress of a milestone has fallen behind the planned timeline, a flame icon will reflect on the burndown chart. |
When the project milestone has progressed positively

When the project milestone is progressing rapidly, in a positive manner, Backlog will praise the top contributing member who completed the most tasks.
Viewing your burndown chart

If you have enabled charts in the project settings and created a milestone, its burndown chart will be displayed on the Project Home page. By default, charts are enabled whenever you create a new project.
|
Tips:
|
To manage settings for the burndown chart, see Update and manage burndown chart settings.
Related Articles
Update and manage burndown chart settings