The Gantt Chart display can be changed based on the following 4 settings:
Start Date
“Start Date” allows you to set the displayed start date of Gantt Chart.
Choose the date you want to set as the start date from the calendar and press "Change". If you press "Today", today’s date will be the start date.
Span
The span of the Gantt Chart can be chosen from 1 Month, 2 Months, 3 Months or 6 Months.
Grouping
Issues will be grouped. If you choose "Assignee", the bars on Gantt Chart will be displayed by Assignee.
Status
If you select a certain status, only the issues with the selected status will be displayed.
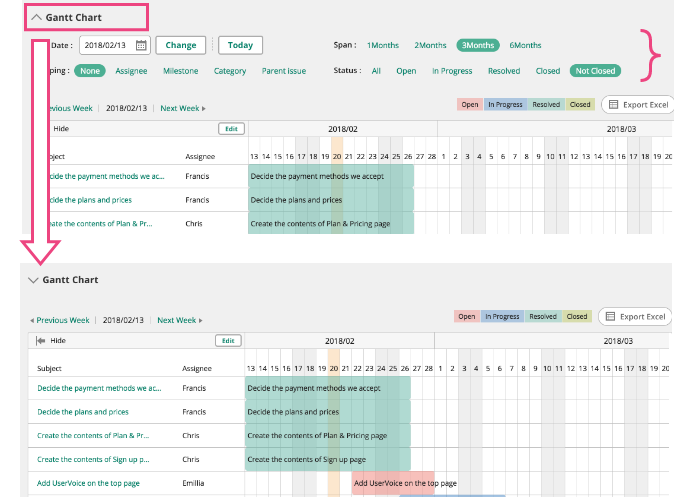
The Gantt chart settings can be folded down to expand the area for the chart.